![]()
Volume 86, Number 1, 2008
- To print this article, click here for the pdf version
- Abstracts of other articles in this issue
- Subscriptions, sample copies, and back issues
Upstream Solutions: Does the Supplemental
Security Income Program Reduce Disability
in the Elderly?
Pamela Herd, Robert F. Schoeni,
and James S. House
University of Wisconsin, Madison; University of Michigan, Ann Arbor
Context: The robust relationship between socioeconomic factors and health suggests that social and economic policies might substantially affect health, while other evidence suggests that medical care, the main focus of current health policy, may not be the primary determinant of population health. Income support policies are one promising avenue to improve population health. This study examines whether the federal cash transfer program to poor elderly, the Supplemental Security Income (SSI) program, affects old-age disability.
Methods: This study uses the 1990 and 2000 censuses, employing state and year fixed-effect models, to test whether within-state changes in maximum SSI benefits over time lead to changes in disability among people aged sixty-five and older.
Findings: Higher benefits are linked to lower disability rates. Among all single elderly individuals, 30 percent have mobility limitations, and an increase of $100 per month in the maximum SSI benefit caused the rate of mobility limitations to fall by 0.46 percentage points. The findings were robust to sensitivity analyses. First, analyses limited to those most likely to receive SSI produced larger effects, but analyses limited to those least likely to receive SSI produced no measurable effect. Second, varying the disability measure did not meaningfully alter the findings. Third, excluding the institutionalized, immigrants, individuals living in states with exceptionally large benefit changes, and individuals living in states with no SSI supplements did not change the substantive conclusions. Fourth, Medicaid did not confound the effects. Finally, these results were robust for married individuals.
Conclusions: Income support policy may be a significant new lever for improving population health, especially that of lower-income persons. Even though the findings are robust, further analyses are needed to confirm their reliability. Future research should examine a variety of different income support policies, as well as whether a broader range of social and economic policies affect health.
Keywords: Disability, Supplemental Security Income, income support policy.
![]() n 1982, the Black Report found that universal health
care in the United Kingdom, which had been in place for more
than twenty-five years, had done little to decrease disparities in
morbidity and mortality by social class (Black et al. 1982). These findings
stimulated more than two decades of research documenting a nearly
universal relationship between socioeconomic status and health, which
have led to theories that socioeconomic status is a fundamental cause
of health (House, Kessler, and Herzog 1990; Link and Phelan 1995).
Fundamental cause theorists argue that policy solutions need to focus on
upstream factorssuch as changes in social and economic policiesas
much as or more than on downstream factorssuch as health care and
behavioral changes (Graham 2004; Herd, Goesling, and House 2007;
House, Kessler, and Herzog 1990; Link and Phelan 1995; Schoeni et al.
Forthcoming). They point not only to the findings from the Black Report
but also to the growing evidence that medical care accounts for
only a limited portion of the variance in population health (McGinnis, Williams-Russo, and Knickman 2002).
n 1982, the Black Report found that universal health
care in the United Kingdom, which had been in place for more
than twenty-five years, had done little to decrease disparities in
morbidity and mortality by social class (Black et al. 1982). These findings
stimulated more than two decades of research documenting a nearly
universal relationship between socioeconomic status and health, which
have led to theories that socioeconomic status is a fundamental cause
of health (House, Kessler, and Herzog 1990; Link and Phelan 1995).
Fundamental cause theorists argue that policy solutions need to focus on
upstream factorssuch as changes in social and economic policiesas
much as or more than on downstream factorssuch as health care and
behavioral changes (Graham 2004; Herd, Goesling, and House 2007;
House, Kessler, and Herzog 1990; Link and Phelan 1995; Schoeni et al.
Forthcoming). They point not only to the findings from the Black Report
but also to the growing evidence that medical care accounts for
only a limited portion of the variance in population health (McGinnis, Williams-Russo, and Knickman 2002).
To date, however, very few studies have examined whether upstream solutionsparticularly social and economic policiesaffect health. Examination of such effects can provide additional and, in certain ways, stronger, evidence that social and economic factors are significant upstream determinants of health. Furthermore, even if there were causal certainty that income affected health, which is still debated (e.g., Adams et al. 2003), we cannot assume that income support policies would affect health. Policies have multiple goals and, more often than not, unintended effects. This makes it necessary to analyze whether specific policies have specific health effects.
In this study, we examine the effects of one important upstream factor: income support policy. In particular, we analyze the Supplemental Security Income (SSI) program, which is targeted at raising the incomes of the poorest elderly Americans. Analyzing the health effects of SSI benefits is useful for substantive and methodological reasons. Past research has generally found a nonlinear relationship between income and health in the United States, particularly in relationship to morbidity; the relationship is stronger for those at the bottom of the income distribution (Backlund, Sorlie, and Johnson 1996; House, Kessler, and Herzog 1990; House et al. 1994; McDonough et al. 1997). There is more conflicting evidence about the relationship between income and health at the top end of the income distribution than at the bottom end (Benzeval, Judge, and Shouls 2001; Bassuk, Berkman, and Amick 2002; Ellison 2002; Martikainen et al. 2001; Norris et al. 2003). Thus, it makes the most sense to examine policies that focus on those at the bottom of the income distribution, such as SSI, which provides a guaranteed minimum income for the poorest elderly Americans. Another advantage of concentrating on SSI is that its maximum allowable benefits vary significantly not only between states at a given time but also within states over time. This variation in policy can plausibly be assumed to be exogenous to the health of the elderly, thus allowing us to test the impact on disability of changing benefit levels within states over time. Using the 1990 and 2000 censuses, we examine the within-state variation in SSI benefits over time to see whether they affect within-state changes in disability among the elderly. We begin by reviewing the limited empirical research that has examined the impact of income support policies and programs on health.
Literature Review
Fundamental Cause Theory
The fundamental cause hypothesis posits that socioeconomic status is not simply a determinant of health differences but is a fundamental cause of these differences. Over the past thirty years, sociologists and epidemiologists documenting the consistent and inverse relationship between socioeconomic status and measures of both morbidity and mortality across time, across countries, and across the life course began to challenge the notion that socioeconomic position was simply a proxy for other factors that negatively affect health, such as access to health care, sedentary lifestyles, smoking, and obesity (Adler et al. 1994; House et al. 1994; Lantz et al. 1998; Link and Phelan 1995). The key evidence supporting fundamental cause theory is that even though the intervening links between socioeconomic status and health have changed over time, the link between low socioeconomic status and poor health has not changed. For example, while the major causes of mortality have changed over the twentieth century, from infectious disease to chronic conditions, socioeconomic disparities in health have either persisted or increased (Link and Phelan 1995; Pappas et al. 1993). In addition, the strong link between socioeconomic status and health persists across countries with vastly different social, political, and economic institutions (World Health Organization 2006) and across the life course within a given country (Herd 2006; House, Kessler, and Herzog 1990).
The policy implication of fundamental cause theory is to place greater emphasis than currently is placed on upstream factors like social and economic status. Fundamental cause theory emphasizes that socioeconomic position shapes access to resources that help individuals avoid risk factors for disease and mortality (House, Kessler, and Herzog 1990; Link and Phelan 1995). For example, in the early part of the twentieth century, wealthier individuals could avoid the kinds of crowded housing conditions that increased risk for infectious disease. Today, wealthier individuals can avoid housing conditions that increase risk for everything from asthma to lead exposure. In both instances, socioeconomic resources are translated into better health, through both the prevention of disease and the management of health problems.
Fundamental cause theory also predicts that policies that target intervening mechanisms, like smoking bans, may not be able to reduce socioeconomic disparities over the long term (Link and Phelan 1995). Eliminating these more proximate risk factors will do little to weaken the link between socioeconomic position and health and may even strengthen it if new risk factors emerge and/or the reduction or elimination of risk factors occurs differentially by socioeconomic position (Graham 2004). For example, smoking campaigns have reduced the overall smoking rate, but the gap between smokers and nonsmokers by educational attainment has grown dramatically (Link and Phelan 1995). In other cases, new diseases emerge that are driven by different risk factors, which those with more limited resources are less able to avoid. For example, the emergence of AIDS over the last twenty years has been patterned by income and education, both within and between countries (Goesling and Firebaugh 2004).
But while downstream policy solutions have received considerable analysis and study, to date there has been very little research on whether upstream policy solutions have any impact on health. In short, when resources are redistributed, how is health affected? While a range of social and economic policies could be considered, we look to income support policy, given that income is a key indicator of socioeconomic status and given the extensive evidence for the strong association between income and health, particularly among low-income individuals. Furthermore, income support programs are arguably the most important mechanisms through which government influences individual well-being, with billions of dollars distributed through such programs each year.
Studies of Income and Health
On what basis might we think that income support policy would affect health? First, there is considerable evidence of a strong association between income and mortality and morbidity. People with lower incomes die sooner than do people with higher incomes (Duleep 1986; Duncan 1994; Fox, Goldblatt, and Jones 1985; Haan, Kaplan, and Syme 1989; Mare 1990; McDonough et al. 1997; Menchik 1993), and they have more chronic conditions, functional limitations, and higher rates of mental health problems and generally report a lower health status (House et al. 1994; Kington and Smith 1997; Mirowsky and Ross 2001; Mulatu and Schooler 2002).
The second reason that income support policies should affect health is that research in the United States has often found a nonlinear relationship between income and health, particularly morbidity outcomes. Although there is some dispute over this nonlinearity, the relationship to health is clear for those at the bottom of the income distribution, whereas the evidence is more inconsistent at the top of the income distribution (Backlund, Sorlie, and Johnson 1996; Bassuk, Berkman, and Amick 2002; Benzeval, Judge, and Shouls 2001; Ellison 2002; House, Kessler, and Herzog 1990; House et al. 1994; Martikainen et al. 2001; McDonough et al. 1997; Norris et al. 2003). Of course, many income support policies target the poorest Americans, and the extent to which these policies reduce entrenched poverty also could have implications for health. Studies have specifically found that the duration of exposure to poverty or low income matters to health; the more prolonged the exposure is, the greater its effect on ones health will be (Lynch, Kaplan, and Shema 1997). For example, compared with those in the 1984 Panel Study of Income Dynamics who had experienced no poverty over the preceding sixteen years, those who had temporarily experienced poverty had self-reported health scores that were 17 percent lower, and those who had persistently experienced poverty had self-reported health scores that were 32 percent lower (McDonough and Berglund 2003).
What is it about having a low income that is bad for ones health? Lack of health insurance surely adversely affects ones access to and quality of health care. Even so, health insurance and health care probably account for, at most, 10 to 20 percent of this relationship (McGinnis, Williams-Russo, and Knickman 2002). More important than health care and health insurance is likely the deprivation associated with lower incomes. Examples of material deprivation include the extent to which poor people have more difficulty meeting basic needs, such as good nutrition and safe and healthy home and work environments, which are necessary for good health (Adler et al. 1994; Stokols 1992; Williams and Collins 1995). For example, low-income children are far more likely to report food insufficiencies and are more likely to be iron deficient (Alaimo et al. 2001). Asthma onset and deterioration is associated with poor housing quality (Fullilove and Fullilove 2000; Kreiger and Higgins 2002). Some studies find that a substantial part of the relationship between low incomes and health can be explained by deprivation, such as individuals reporting that they could not afford basic amenities like housing, food, and clothing (Stronks, van der Mheen, and Mackenbach 1998).
Another important explanation is that low incomes are predictive of other psychosocial and behavioral risk factors, which, in turn, are predictive of health (House and Williams 2000). Low-income people are more likely to face high levels of stress, which play a significant role in the onset of disease (Adler et al. 1994; Byrne and Whyte 1980; Cohen, Tyrell, and Smith 1993; Hayward, Pienta, and McLaughlin 1997). One recent study found a link between high perceived levels of stress and aging at the cellular level; high stress increased aging by almost ten years (Epel et al. 2004). Low-income individuals are more socially isolated and feel they have less control over their lives, both of which are predictive of poor health (House, Landis, and Umberson 1988; House and Williams 2000; Rodin 1986; Rowe and Kahn 1987; Turner and Noh 1988; Turner and Marino 1994). Finally, individuals with low incomes are more likely to smoke, be obese, be sedentary, and consume too much (or too little). However, any single set of these factors (e.g., health behaviors, stress, social relationships and support, or psychological disparities) can account for just 10 to 20 percent of the association between socioeconomic status and health (Lantz et al. 1998, 2005; Marmot 2004).
While the potential pathways by which income can influence health are numerous, the notion that low income has a causal effect on health is controversial. Some argue that health is a human capital variable (alongside education, training, and so forth) that determines economic well-being, not the reverse (Grossman 1972). Health shocks lead to high out-of-pocket medical expenses, job loss and wage reductions, as well as changes in consumption behavior, all of which limit the ability to accumulate income and assets (Lillard and Weiss 1996; Palumbo 1999; Smith 1999). Alternatively, it has been argued that some other factors may causally influence both income and health and that the income-health association is simply spurious. For example, perhaps there are genetic factors that determine both health and income.
Thus there is a small but growing body of literature examining reverse causality in the relationship between income and health. Most researchers conclude that income is likely a determinant of health and that health is likely a determinant of income, but the strength of the relationship in either direction is contested (Adams et al. 2003; Adda, Chandola, and Marmot 2003; Frijters, Haisken-DeNew, and Shields 2005; Lindahl 2005; Smith 1999). Sociological, psychological, and biomedical scientists generally conclude that the bulk of the flow is from income to health, at least in terms of longer-term and more consequential (e.g., mortality, serious morbidity) physical health outcomes. Economists, however, are more inclined to emphasize the shorter-term impacts of health on labor market activity and income.
Exploring the relationship between income support policies and health may help clarify the relationship between income and health. Changes in income support policies can represent an exogenous shock, or natural experiment, thus providing an alternative way to address the causal direction of the relationship between income and health.
Studies of Income Support Policies and Health
A few studies have examined the influence on health of income support policies per se, with much of the recent work having tested this relationship in the developing world. These latter studies have generally shown positive health impacts of income supports on poor individuals (Case 2004; Gertler 2000).1 The few studies conducted in the developed world, which we detail later, have focused on U.S. social policies and also have indicated positive, though not unequivocal, impacts of income support policies on health.
Several studies have concentrated on how income subsidies for low-income individuals affect birth weight. The first came out of the negative income tax experiments in the early 1970s, which were developed to examine the effects of the then proposed Nixon Family Assistance Plan. The Gary Income Maintenance Experiment was used to study how low birth weights were affected by the improvements in income (Kehrer and Wolin 1979). Most of the participants were African American, with a high concentration of female-headed households. Of the 1,799 participating families, 1,028 received supplements and 771 were controls. Data were collected on 104 infants born to the participants between 1970 and 1974. The guarantee levels were equal to the poverty line, but medical expenses were subtracted from family earnings before applying the payment formula. Women in the experimental group who had health characteristics that put them at a high risk for having a low-birth-weight baby experienced a significant reduction in low-birth-weight births. These experiments, however, have been criticized for design and methodological problems, which then called into question the validity of the findings associated with them (Moffitt 2004).
Currie and Cole (1993) looked at the effect of Aid to Families with Dependent Children (AFDC) on birth weight in a nonexperimental design using instrumental variable techniques. They found a positive and significant effect of participation in AFDC on birth weight for poor white mothers and a positive and insignificant effect for black mothers. However, when looking at sibling comparisons to control for unobserved variable bias, these effects dissipated.
At the other end of the life course, a study by Taubman and Sickles (1983) examined the effect of Supplemental Security Income (SSI) on the health of elderly beneficiaries. SSI is a means-tested income supplement program for the elderly, blind, and disabled that was implemented in 1974. The authors used the Retirement History Survey to examine how the health of elder recipients changed after they started receiving SSI. They found that SSI had a positive impact on the health of elderly beneficiaries. The health of individuals eligible for SSI before its implementation was statistically significantly worse than the health of those not eligible. In both 1975 and 1977, this disparity in heath was no longer significantly different between these two groups.
To our knowledge, only one study has reported on an income support policy that had negative health impacts. Snyder and Evans (2006) used a quasi-experimental design to examine the impact of varying Social Security benefits on mortality. Errant Social Security legislation led to a notch, with individuals with the exact same work histories born just before January 1, 1917, receiving higher Social Security benefits in old age than those born just after this date. Accordingly, the study compared the mortality rates of those born in the last three months of 1916 (the experimental group) with those born in the first three months of 1917 (the control group). The experimental group, whose Social Security benefits were about 7 percent higher than those of the control group, despite similar work histories, also had higher mortality rates after age sixty-five than did the control group. Additional analyses showed that the control group that had lower benefits were more likely to work after retiring, probably to augment their lower benefits. The authors concluded that this led to more social interaction and thus lower mortality.
While the use of the notch to help identify the effects of Social Security on health is novel, some features of this approach also are problematic. Most important, the study looked at how minimally to modestly higher Social Security benefits affected the health of wealthier and healthier individuals. Previous research, however, has shown that the relationship between income and health is stronger at the bottom, as opposed to the top, of the income distribution. The evidence regarding the relationship between income and health at higher income levels is less consistent. A notch beneficiary retiring at age sixty-two without a high school degree had just a 1 percent ($5 per month) higher benefit. Moreover, healthier beneficiaries received larger benefit increases because those retiring at age sixty-five received larger benefit increases than did those retiring at age sixty-two, who tend to be sicker than later retirees (Haveman et al. 2003). Those who retired around age sixty-two had a very limited benefit increase, $7 a month, whereas those retiring at sixty-five had an average $110 increase. Consequently, this study largely measured the effect of increases for those who were, on average, wealthier and healthier. Our study, however, focused specifically on the effects of income supports to poorer individuals.
Public Income Supports in Old Age
While these previous studies provide some intriguing findings, more research is clearly needed on whether public income supports affect health. Old age policy provides a promising avenue for research because income supports are so substantial among the elderly, especially in comparison with income supports early in the life course. Social Security, of course, is the most extensive income support program in the United States, and it has substantially both increased income levels and reduced poverty levels among the elderly (Engelhardt and Gruber 2004). Moreover, although some younger individuals are eligible for SSI, unlike the elderly they must qualify on the basis of disability as well as income. Another reason that old-age policies provide a promising avenue for research is that health events are concentrated among older people. It often is difficult to capture significant levels of variation in health among younger individuals, especially using standard survey measures of health. Yet, beyond the work of Taubman and Sickles (1983) and Snyder and Evans more recently (2006), there has been no direct effort to evaluate the impact of old-age income supports on health.
Evidence from the Supplemental Security Income Program
Created in 1972 to provide a minimum income guarantee for the elderly, SSI is targeted at the poorest elderly Americans. At that time, minimum income guarantees varied greatly at the state level. Then Congress stepped in and established a federal minimum income guarantee, set at about three-quarters of the poverty line. In 2000, the federal monthly maximum benefit for the elderly under SSI was $512 for single individuals and $769 for married couples. Overall, about 6 percent of the elderly receive SSI benefits.
The states, however, can supplement the federal minimum benefit, and twenty-six states do so. Thus, SSI maximum benefits vary between states and within states over time. The variation within states over time, which is the focus of this study, is plausibly exogenous with respect to individual health or disability. This exogenous variation allows us to test the impact on disability of changing benefit levels within states over time.
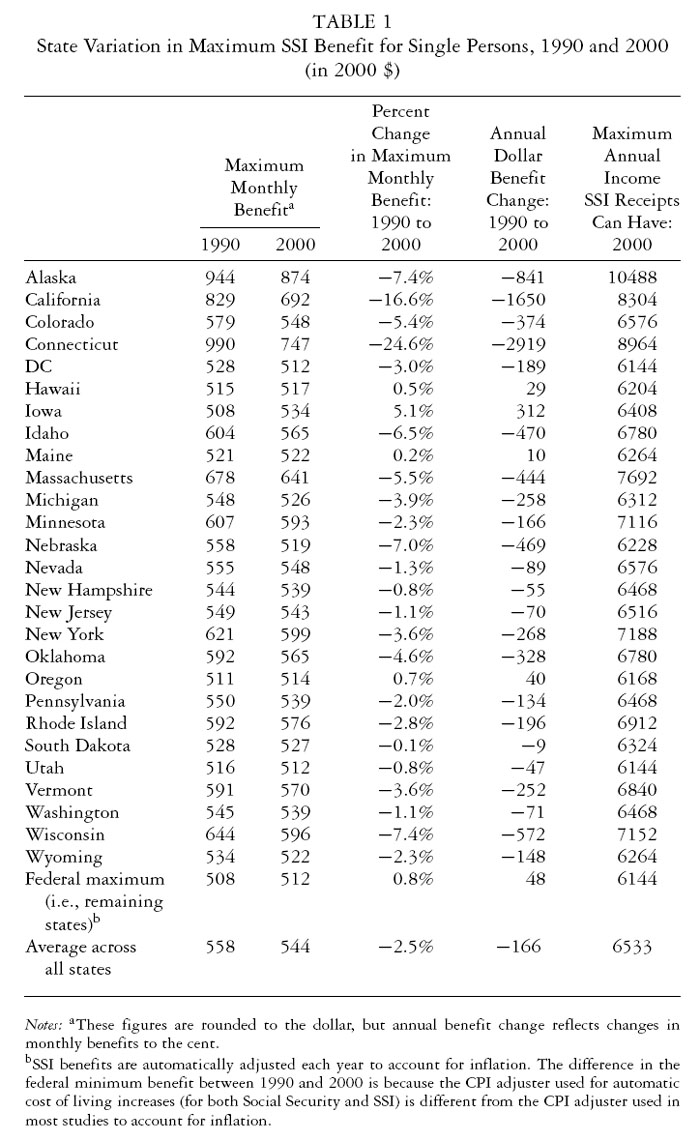
How large is the variation within states over time? Table 1 shows the magnitude of benefit change over the time period examined in this study, 1990 to 2000. The first two columns in table 1 show the maximum monthly benefit levels for each state, in year 2000 dollars, for single individuals in 1990 and 2000. In total, in 1990 and 2000, twenty-six and twenty-five states, respectively, provided a supplement to the federal benefit, ranging from just a few dollars to $482 (Connecticut in 1990). The states not included in this table had SSI monthly maximum benefit levels set at the federal minimum in 1990 and 2000. The benefit levels in almost all states were well below the poverty threshold in 2000, which was $688 a month or $8,259 annually.
The third column shows the overall percentage change in benefits between 1990 and 2000. While some of the percentage changes in benefits are modest, others are quite substantial. Ten states had annual changes in benefits of +/− $300, and just nine states had changes smaller than +/− $100 (column 4). These are substantial amounts relative to the maximum income levels that individuals can obtain and still be eligible for SSI (column 5). Moreover, because correlational studies of income and health indicate that even small differences in income at the bottom end of the income distribution are correlated with significant differences in health, it is reasonable to assume that the differences in income displayed in table 1 could lead to changes in disability.
Overview of the Analysis
We used within-state changes in SSI benefit policy between 1990 and 2000 to examine the effect of the SSI program on disability among elderly Americans. Numerous studies have used within-state variation in maximum SSI benefits to examine its effects on trends in retirement, savings, and living arrangements among the elderly (Costa 1999; McGarry and Schoeni 2000; Neumark and Powers 1998, 2000, 2003). We extended these analyses to look at disability. We look at the relationship between maximum state SSI benefits and disability outcomes, as opposed to the relationship between individual SSI benefits and disability outcomes for two reasons. First, using the SSI benefit actually received by an individual, or even the average benefits for a state, would produce endogeneity problems because SSI benefits are inversely related to labor force participation and earnings, which are correlated with health. A wealth of research shows that poor health limits labor force participation and earnings (Anderson and Burkhauser 1985; Bound et al. 1999). Thus, an individual with large SSI benefits would likely be in worse health than an individual with smaller SSI benefits because the larger ones SSI benefit was, the less time that person would have spent in the labor force during his or her working years. This persons participation in the labor force may have been limited by poor health. So the relationship between the benefit and health outcomes would be confounded by an individuals health status before his or her receipt of the benefit.
Another problem pertains to data quality. There is considerable evidence that SSI incomeand income at the lowest income percentiles, for that matteris misreported in surveys (Bollinger 1998; Huynh, Rupp, and Sears 2001). The potential for misreports is even higher in these data because the 1990 census did not explicitly collect information about SSI income. Information about SSI income is derived from a general question about welfare income. These measurement issues also made us wary of employing instrumental variable techniques (using the SSI maximum to instrument individual SSI benefits). But we did test whether the SSI maximum predicts individual SSI benefits and income, and even if there are errors, this test supports the notion that increases or decreases in the SSI maximum do affect income. For these reasons, we focused on maximum state SSI benefits rather than individual SSI benefits.
The analysis then asked: Do increases in maximum state SSI benefits affect disability in the elderly? We used census data with state and year fixed-effect models to examine whether increases in the state maximum SSI benefit between 1990 and 2000 led to changes in disability. The substantive rationale for using the maximum state SSI benefit is that it allowed us to answer directly whether an income support policy affects disability, which from the perspective of a policy analyst is a critical question. An added benefit of this approach is that from a policy perspective, it answers exactly the question facing policymakers: how will population health be affected if we modify the generosity of the program?
This approach has some important caveats, however. First, to address selection effects, our main analysis did not restrict the analysis to SSI recipients (although we did report sensitivity analyses that do make this restriction and yield results consistent with our main analysis). Thus, while we correctly estimated the effects for the population we were examining, that is, how changes in maximum SSI benefits would affect the prevalence of disability among single elderly Americans, our main analyses did not estimate the effects of changes in maximum SSI benefits among SSI recipients. Our main analysis approach, commonly used by scholars studying the effects of welfare programs that pertain to relatively small portions of the population, is preferable for methodological reasons (Baker and Royalty 2000; Currie and Grogger 2002; Currie and Gruber 1996; Dooley et al. 2000; Grogger 2003; Hoffman and Foster 2000; Joyce and Kaestner 1996; Lichter, McLaughlin, and Ribar 1997; McGarry and Schoeni 2000; Moffit 1994; Rosenzweig 1999). Restricting the analyses to those on SSI leads to biased estimates because changes in benefit generosity can influence enrollment in the program per se, which is possible given that only half those eligible for SSI receive it. If any characteristics of these individuals are correlated with health, this can be problematic. For example, perhaps an increase in the benefit is particularly likely to induce healthier people to take up the benefit. So while it seems that within-state increases in SSI benefits bring improvements in health, it could really be that in the year with higher benefits, healthier people were more likely to enroll in the program, leading to an upwardly biased estimate. The reverse also could be possible, which would produce a downwardly biased estimate. In either case, there is no way to know for sure whether the composition of the population receiving SSI benefits between 1990 and 2000 has changed in ways that would produce biased estimates, so it is safer to avoid analyzing only SSI recipients. The second problem with focusing on only SSI recipients is that we did not have accurate estimates of SSI receipt in the U.S. Census. The 1990 census asked only about welfare income, not SSI specifically. And in 2000, according to the Social Security Administration, 10 percent of single individuals should have been reporting SSI receipt, but only 8 percent did report receiving it in the 2000 census.
Finally, a key assumption of this approach is that changes in the states maximum SSI benefits are exogenous to changes in state old-age disability rates, conditional on changes in sociodemographic and other factors accounted for in the regression. While not innocuous, this assumption has been asserted in a series of papers evaluating the effects of SSI on retirement, savings, and living arrangements (Costa 1999; McGarry and Schoeni 2000; Neumark and Powers 1998, 2000, 2003). Moreover, many of the changes in state maximum SSI benefits reflect neglect rather than deliberate action. That is, the real benefits in several states were reduced because they did not adjust their supplements for inflation.
Data and Samples
The data used in these analyses were drawn from the 5 percent samples from the 1990 and 2000 censuses as compiled by the Integrated Public Use Microdata Series (IPUMS). These are microlevel data from the census long forms from both years. The questionnaires are self-administered.
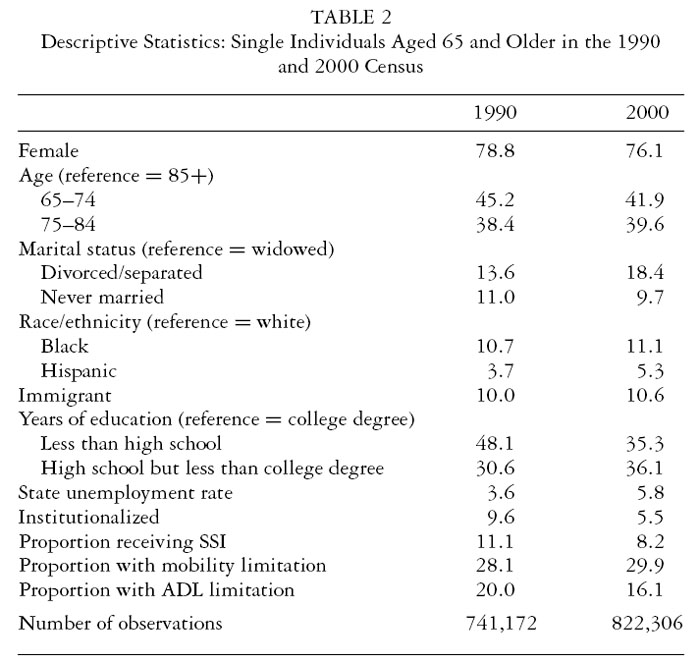
The primary focus of this study is single individuals aged sixty-five or older, and the descriptive statistics of the key variables for this sample are displayed in table 2. The substantive rationale for focusing on single individuals is because they are far more likely to be poor and rely on SSI than married couples are; single individuals comprise 80 percent of all SSI beneficiaries (Martin and Davies 2003). In addition, concentrating the analyses on single individuals helps balance the concerns of endogeneity with the reality that a substantial share of the general population does not receive SSI benefits. A sample restricted to SSI recipients, or those who are eligible for SSI, would suffer from endogenous sample selection, whereas a sample that included the entire elderly population may hide a true relationship if such a relationship existed.
Our main dependent variable is a measure of disability included in both the 1990 and 2000 censuses. Specifically, the respondent indicated whether he or she had any health condition that had lasted six or more months and that made it difficult or impossible to go outside the home alone. The validity of such self-reported disability measures is supported by the fact that they independently predict Medicare health spending and mortality (Ferraro and Farmer 1999; Komisar, McCool-Hunt, and Feder 1998). At the same time, these measures also are influenced by socioeconomic factors and the environment (Pope and Tarlov 1991; Verbrugge and Jette 1994). For example, a higher income may allow individuals to purchase assistive technologysuch as a cane, a walker, an apartment with an elevator, or a home in a neighborhood that has curb cuts in the sidewalkswhich in turn allows elderly to leave their homes. Therefore, the effect being estimated may be due to changes in underlying health or changes in the ability to cope with health conditions, and data limitations do not allow us to disentangle these competing pathways.
The predictor variable of primary interest is the maximum state SSI benefit, which is merged with the microdata for the 1990 and 2000 censuses. All income measures are adjusted for inflation, using the CPI, to the year 2000. The predictor covariates include age, sex, marital status (widowed, divorced, never married), race/ethnicity (Hispanic, non-Hispanic black, and non-Hispanic white), immigrant status (foreign born or not), educational attainment (less than high school, high school but not college graduate, college degree), state unemployment rate, and institutional status. To control for within-state changes in economic conditions between 1990 and 2000, the state unemployment rate is included. Earlier studies have shown a strong connection between unemployment rates and health, even for the elderly (Ruhm 2000). Institutional status measures whether an individual lives in an institution. A living situation is defined as an institution if the individual is in formally authorized, supervised care or custody in places such as nursing homes, hospitals, mental institutions, and jails. Because SSI can be used to pay for institutional care, it is important to control for this factor. The last covariates necessary for the fixed-effect models include state of residence and census year (1990 or 2000).
Changes in all variables between 1990 and 2000 were generally as expected (table 2). The older population is living longer and becoming more male, more racially and/or ethnically diverse, and better educated. The changes for indicators of disability are slightly more mixed but generally consistent with other data.2
Analytical Approach
The estimation approach identifies the effect of the SSI program through changes in policies within states over time. The dependent variable has a value of 1 if an individual i at time t is disabled. The model is
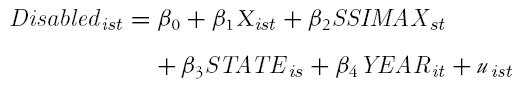
where X is the vector of covariates (including sex, age, race, ethnicity, immigrant status, educational attainment, state unemployment rates, and institutional status) for individual i at time t in state s. These covariates are intended to address factors that may produce a spurious correlation between SSIMAX and the dependent variable. SSIMAX is the maximum SSI benefit in state s at time t. STATE represents state fixed effects, YEAR represents year fixed effects, and uist is the error term. We reported standard errors for all models that allow for an arbitrary correlation matrix within states (the so-called Huber-White sandwich estimator) because of the possibility of serially correlated errors within states. While the reported analyses were conducted with OLS models, probit model analyses showed no meaningful differences in the estimated effects or statistical significance. Thus, for ease of interpretation we presented the OLS analyses. Weights were employed in all analyses.
A variety of sensitivity analyses were performed to test the reliability of the results. First, we examined two different income subgroups of single individuals, those below the twenty-sixth income percentile and those above the seventy-fourth income percentile, within states.3 The expectation is that the SSIMAX coefficient would increase in size and significance when focusing on a poorer population, because high proportions of SSI beneficiaries would be concentrated at the bottom of the income distribution. Analyses on the entire population of single individuals should lead to a diluted effect because few higher-income individuals receive SSI. In contrast, SSIMAX should shrink to insignificance when examining those above the seventy-fourth income percentile because this relatively affluent population should not be influenced by SSI policy. Although not included in the tables, we also tested the effects for those between the fiftieth and seventy-fifth income percentiles, in which effects also should not be seen. Finally, we analyzed the 1990 and 2000 data cross sections separately to test whether they confirmed the time series findings. The results, not shown here, did confirm the time series findings.
Second, for single individuals, we also performed analyses on an alternative dependent variable, one that represents limitations in activities of daily living (ADL). Specifically, the census ADL measure indicates whether individuals have difficulty with personal care needs such as bathing, dressing, and getting around the house.
Third, we conducted a series of analyses to test the strength of the findings when certain individuals or control variables were included or excluded. We excluded those individuals in states with the highest change in benefit levels (Connecticut and California) from the analyses to confirm that there were no outlier effects. We also excluded those individuals in states that had no benefit change to confirm that changes were driven by states with actual changes in benefits. Because the SSI benefit distribution among the elderly is largely among those not institutionalized, we also excluded institutionalized individuals from the analysis as an additional test. For the main analyses, however, we did not exclude institutionalized individuals because this would likely introduce errors, since the composition of those institutionalized changed throughout the 1990s. That is, those occupying nursing homes were much sicker in 2000 than were those in 1990. Fourth, we included Social Security income as a control. For those at the bottom of the income distribution, Social Security comprises the bulk (more than 90 percent) of their income. Thus, we accounted for other changes in income between 1990 and 2000. Our base analyses did not include this variable because of the endogeneity it can introduce. Although not reported in the table, we also included sensitivity analyses that measure the effects on only those reporting receiving SSI. The effects were significant and larger than those reported for individuals below the twenty-sixth income percentile among both single and married people (for single people, the coefficient size was 12 percent larger, and for married people, it was double the size). But given the reporting problems in the census and concerns about how the sample of SSI recipients may have changed over the time period, we considered these estimates to be much more subject to error and biased than the results of our main analysis.
The fourth sensitivity analysis tested for effects on married individuals. Because SSI benefit levels and benefit eligibility vary by marital status, these results must be analyzed separately from those for single individuals. As stated earlier, we anticipated these estimates to be smaller, since relatively few married individuals receive SSI. Nonetheless, SSI should still have an effect on this group.
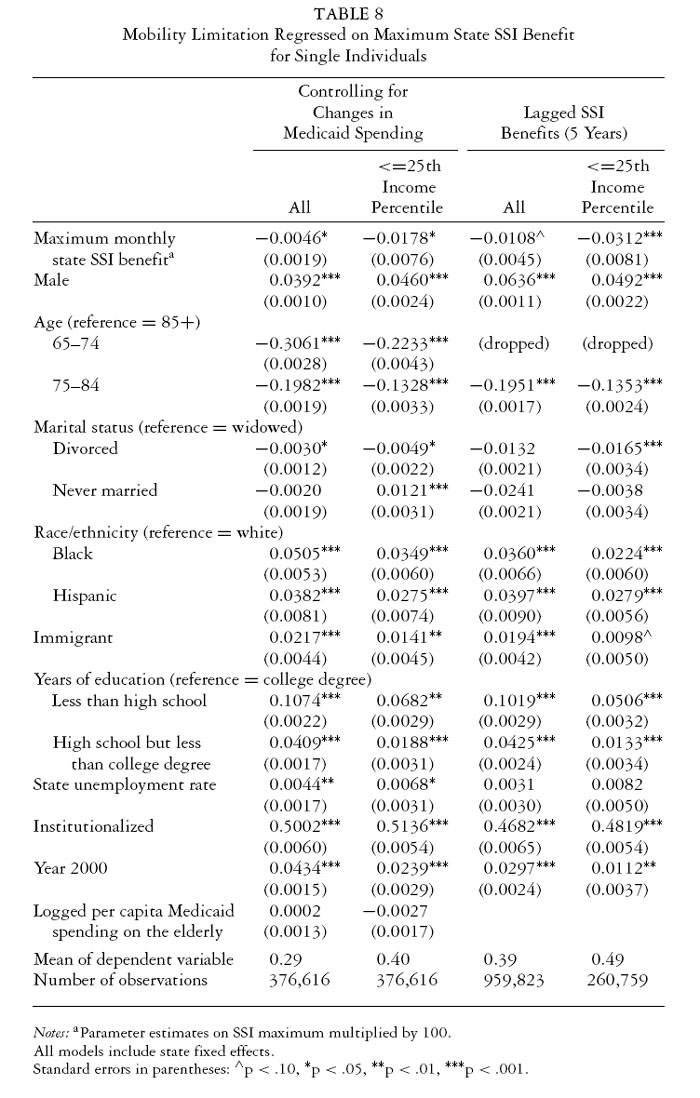
The fifth set of sensitivity analyses addressed whether the effect of income supports was lagged. Although some of the effects of increased income might affect disability in the short term, other effects might take longer. Examples of short-term effects are immediate spending on nutrition and housing adaptations, which could substantially help older people become more mobile. In fact, the PROGRESA experiment in Mexico showed large health and disability changes over just a two-year period with increases in income (Gertler 2000). We tested the lagged effects in two ways. First, we explicitly tested for a five-year lagged effect by measuring whether maximum SSI benefit changes from 1985 and 1995 were correlated with mobility limitation changes between 1990 and 2000. This test must focus on those aged seventy-five and older, because those aged sixty-five to seventy-five in 1990 were not on SSI in 1985. Second, we concentrated on those aged seventy-five and older (with both the SSI maximum and mobility limitations measured in 1990 and 2000) who had been on the SSI program longer and thus should have experienced larger effects than younger individuals did. Although the second set of results is not shown here, we did find larger effects for those aged seventy-five and older. Compared with the size of the effect on those aged sixty-five and older, the effect on those aged seventy-five and older was 40 percent larger. (The five-year lagged effects are shown in table 8.)
The last sensitivity analysis looks at whether other factors were correlated with within-state changes in SSIMAX over time that might lead to a spurious correlation between SSIMAX and disability. Of particular concern was that Medicaid eligibility is linked to SSI eligibility. These results might reflect Medicaid program effects, as opposed to SSI policies. Changes in SSI benefits automatically lead to changes in Medicaid eligibility. It is, however, important to keep in mind a few factors. First, these changes will be problematic for only those individuals with incomes falling between the SSI federal benefit and the maximum state benefit. More than 85 percent of SSI beneficiaries in states with supplements have incomes below the federal maximum (Social Security Administration 2001). Thus, these individuals would remain eligible for Medicaid, regardless of whether the state supplement changed. Second, almost all these individuals, given their slightly higher incomes, also receive Social Security benefits and consequent Medicare coverage. The Medicaid eligibility simply gives them more insurance to supplement their Medicare benefits. Furthermore, every elderly American in every state can receive some supplemental Medicaid insurance if his or her income falls below 150 percent of the poverty line. Almost half the states with supplements provide Medicaid benefits to those whose incomes fall below 100 percent of the poverty level (keeping in mind that the state supplement almost never brings these peoples incomes above the 100 percent poverty level). All states are required through the Medicare QMB and SLMB programs to provide varying degrees of coverage, up to the 150 percent of the poverty level. Although these benefits are not as generous as a full Medicaid supplement, this softens the effect. All of that said, we still provide additional analyses, using the Current Population Survey, to examine whether changes in maximum state SSI benefits between 1992 and 2000 were correlated with changes in Medicaid participation.4
The other way in which Medicaid may pose a problem is if the generosity of Medicaid benefits for the elderly was correlated with changes in maximum SSI benefits within states. We addressed this concern in two ways. First, we included, as a control variable, logged per capita (inflation-adjusted) Medicaid spending for the elderly in the years 1992 and 2000 (the only years with available state-level Medicaid spending data on the elderly). (Table 8 also reports these results.) Second, we constructed a variable that accounted for changes in Medicaid benefits relevant to the elderly based on data from 1991 and 2002 (again, the only years with available data). In short, the state Medicaid programs must cover a large set of services, but the states can choose to cover certain benefits (ranging from podiatry to personal care services), even though all states covered prescription drug benefits in both 1991 and 2002. The data on optional state Medicaid benefits were not strictly comparable across these two years, so we constructed a measure of generosity (offered benefits/potential offered benefits). This second analysis is not included in the tables, but the inclusion of this variable did not alter the findings.
Results
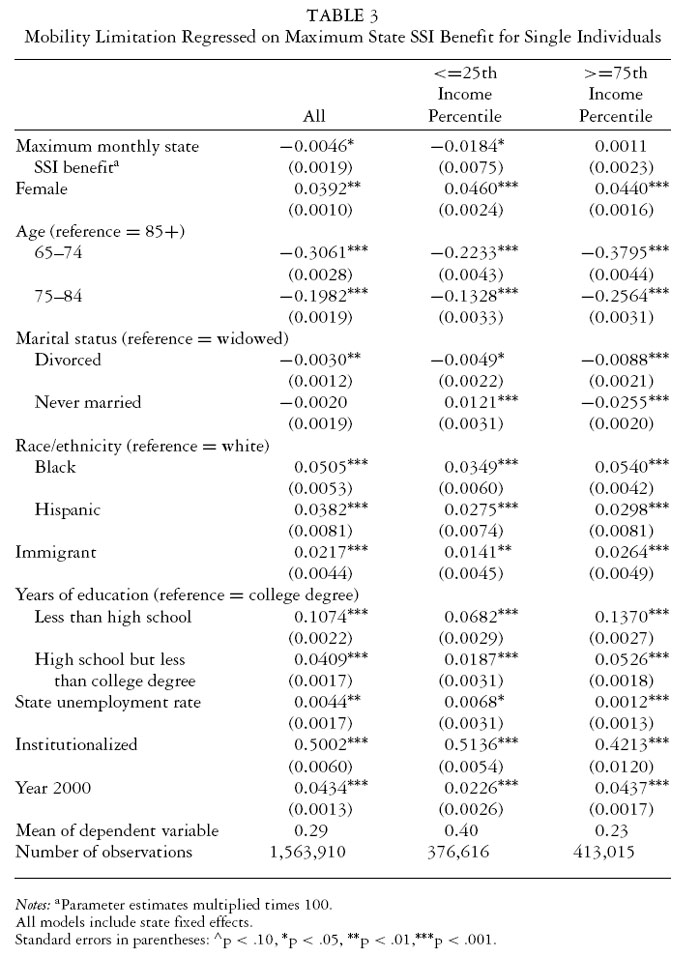
The results support the hypothesis that more generous SSI benefit levels lead to reductions in disability. Table 3 shows the results for all single individuals and the two subgroups of low- and high-income single individuals. These findings answer the policy-relevant question of whether changes in the states maximum SSI benefits over time lead to changes in disability.
Across all models in table 3, the demographic covariates respond as expected. Being black, female, and older; having low educational attainment; being an immigrant; and being institutionalized all have a significant and positive association with disability, as do the states unemployment rates.
The first model in table 3, which includes all single individuals, shows that the key variable of interest, the SSI monthly state maximum benefit, is a significant and negative predictor of mobility limitations for single individuals: the higher the state maximum is, the lower the rate of disability will be.5 The coefficient shows that a $100 increase in the maximum monthly SSI benefit leads to a 0.46 percentage point decline in the probability of having a mobility limitation. Note, however, that the size of this effect is spread across the entire population of single elderly Americans, in which just around 10 percent of individuals report receiving SSI benefits.
Focusing on the population segment that is most likely to be influenced by SSI policy, we limited the sample by examining individuals below the twenty-sixth income percentile. The size of the effect for this group increased fourfold, compared with model 1 (which included all single individuals). This was expected, given that SSI recipients have very low incomes. In terms of magnitude, the estimate shows that an increase of $100 in the maximum monthly state SSI benefit leads to a 1.8 percentage point decline (from 39 to 37.2 percent) in the probability of having a mobility limitation among these low-income individuals. In column 3, the sample is limited to those above the seventy-fourth income percentile. By examining the population who would be well outside the eligibility guidelines for SSI, we would expect to see no effect of SSI. Indeed, this is what happened: the coefficient on SSI monthly state maximum is substantively small and no longer statistically significant. Although not presented in the table, the effects also were insignificant for those between the fiftieth and seventy-fifth income percentiles.
Further sensitivity analyses ruled out additional concerns. First, findings using ADL limitation as the dependent variable generally corroborated the findings with mobility limitations as the dependent variable (see table 4). When all single individuals were included in the sample, the maximum monthly state SSI benefit was not significant, although the coefficient was negative. When focusing on those below the twenty-sixth income percentile, the maximum state SSI benefit became marginally significant and the coefficient tripled in size. For every $100 increase in the monthly maximum state SSI benefit, the probability of having an ADL limitation dropped by 1.2 percentage points. And as expected, when narrowing the sample to those above the seventy-fourth income percentile and those between the fiftieth and seventy-fifth income percentiles (not reported in table 4), the maximum SSI benefit was no longer statistically significant or substantively meaningful.
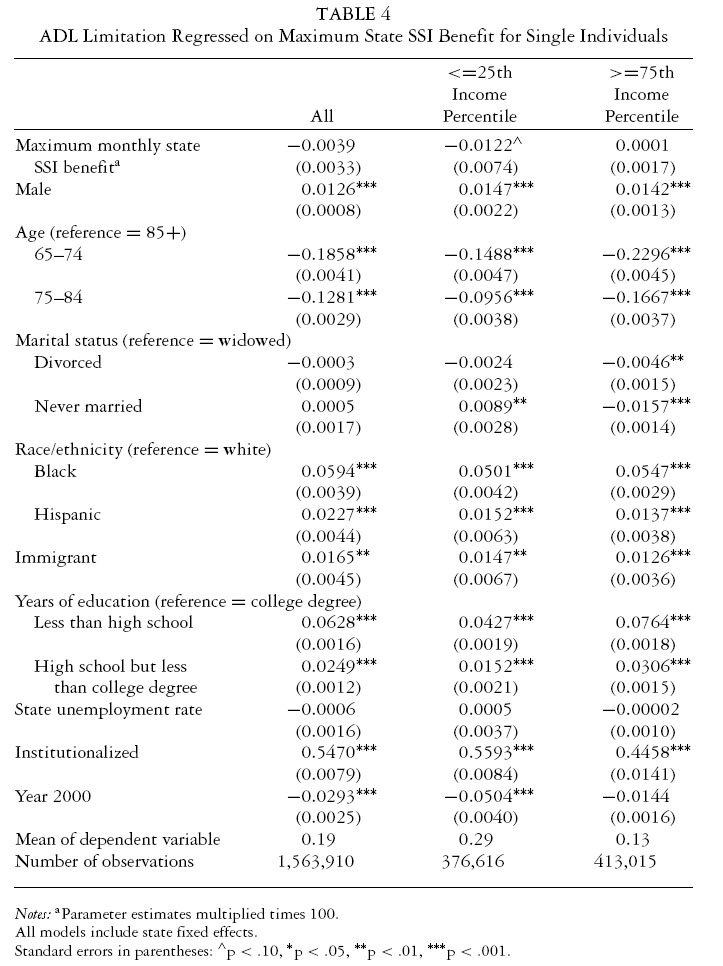
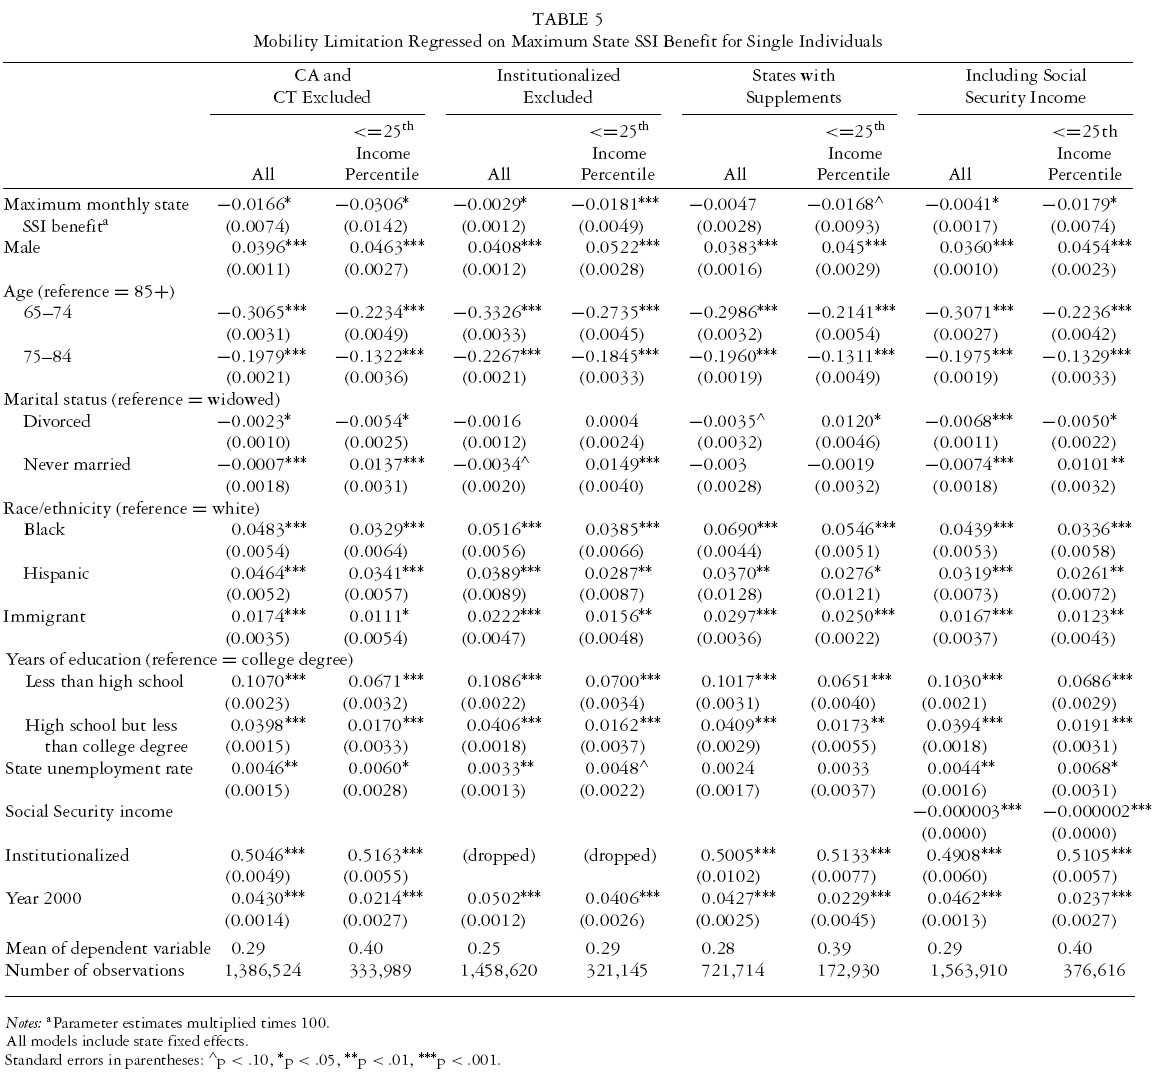
Table 5 shows an array of other sensitivity analyses. The results are based on all single individuals over age sixty-five as well as those below the twenty-sixth income percentile, and the dependent variable measures mobility limitations. Columns 1 and 2 display results that exclude California and Connecticut from the analyses. Connecticut has the largest supplement, and these two states had the largest decrease in SSI benefits between 1990 and 2000. Compared with the original model in table 4, the coefficients are larger, which suggests that the results were not influenced by outliers. For all single individuals, the percentage point reduction in mobility limitation for every $100 increase in the maximum SSI benefit was 1.66, compared with 0.046 in the original model, and among those below the twenty-sixth income percentile, the percentage point reduction was 3.06, compared with 1.84 in the original model. Columns 3 and 4 give results that excluded the institutionalized population from the analyses. For all single individuals, the estimated effect of a $100 increase in SSI monthly benefits was a percentage point decline in mobility limitations of 0.29, compared with 0.46 in the original model. But when focused on those below the twenty-sixth income percentile, the effect size was 1.81 percentage points, which is very similar to the estimated effect of 1.84 percentage points when the institutionalized are included.
The next two columns show the results when those states without a supplement were excluded from the analyses. Compared with the original analyses, the percentage point reductions in mobility limitations were the same as or slightly smaller (0.47 and 1.68), and the standard errors were just slightly bigger, but the substantive conclusion, that higher SSI benefits lead to lower disability, was the same. The last column includes the amount of Social Security income received by the individual. This sensitivity analysis demonstrates that the inclusion of Social Security income has almost no impact on the results. In sum, all these tests on single individuals continue to support the finding that within-state changes in the state SSI maximum predict changes in mobility limitations.
Although our analyses focus on single individuals, because they comprise the large majority of SSI recipients, some married individuals do receive SSI. Table 6 shows the findings for married individuals. As expected, the effects were much smaller than those for single individuals. For example, for all single individuals the percentage point reduction was 0.46, and for all married individuals the percentage point reduction was 0.20. And for those below the twenty-sixth income percentile, the percentage point reduction was 1.84 for single people, compared with 0.40 for married individuals. Although not reported in the table, the effects for those who reported receiving SSI were significant, and the percentage point reduction was 0.9 for married couples. Finally, as with single individuals, there was no significant relationship between the SSI maximum and mobility limitations for married individuals above the seventy-fourth income percentile or between the fiftieth and seventy-fifth income percentile (the latter results are not reported in table 6).
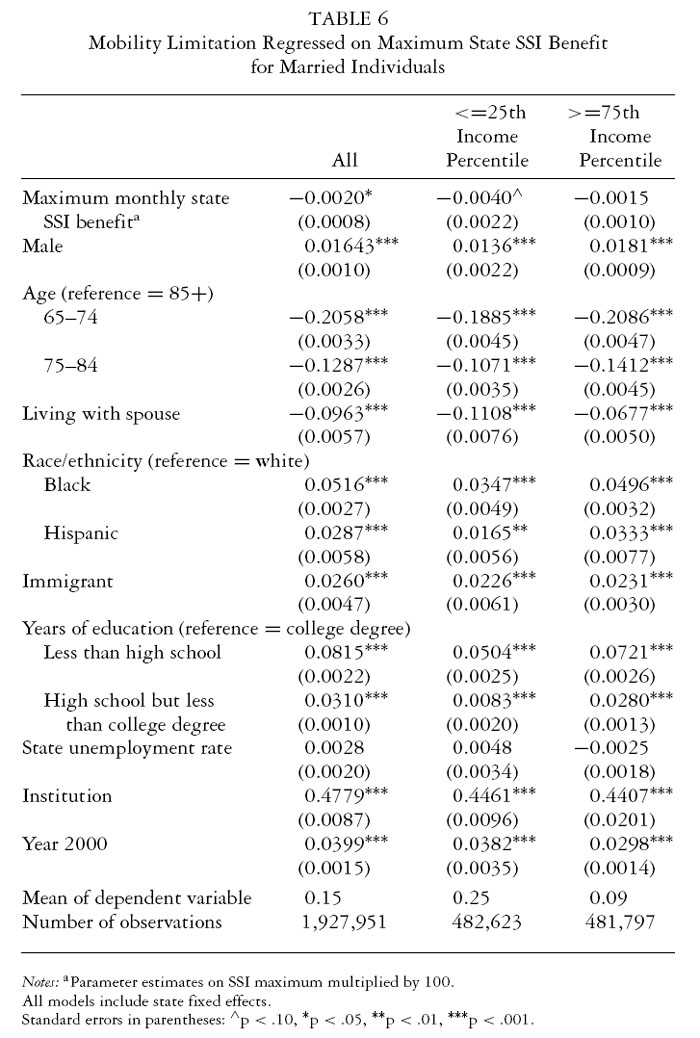
Table 7 shows the results from tests of whether the effects of SSI policy on disability were due to associated increases in Medicaid receipt. Although the OLS results are presented, the probit analyses produced no meaningful differences in the estimated effects or statistical significance. Analyses using the March Current Population Survey (CPS) demonstrate that within-state changes in the SSI maximum over the 1990s were not correlated with within-state changes in Medicaid receipt. Other analyses (not included here) examined the relationship between SSI state maximums and administrative Medicaid data (in aggregate state participation by age). Similar to the self-reported data in the CPS, there was no evidence of a relationship. As stated earlier, these results are not surprising, given the very small percentage of individuals who might not receive Medicaid as a supplement to their Medicare owing to changes in SSI benefits.
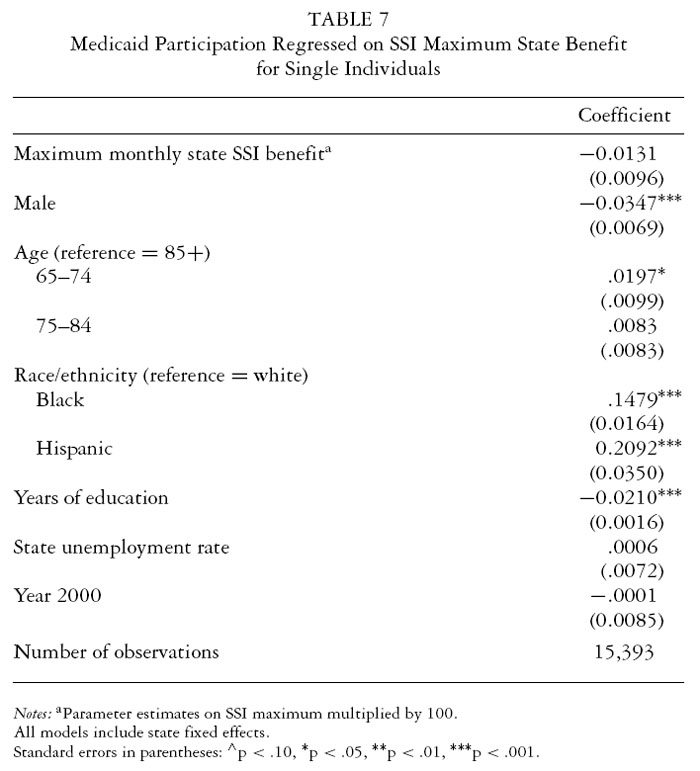
Table 8 includes two final sets of sensitivity analyses. The first two
columns report, for all single individuals and those below the twenty-sixth
income percentile, the effect of including logged per capita Medicaid
spending on the elderly. This variable was not significant and
produced no change in the SSI maximum coefficient. As already stated,
a variable that looked at changes in optional state Medicaid benefits also
produced no significant effect or change in the SSI maximum coefficient.
The last two columns report the five-year lagged effect for single
individuals and those below the twenty-sixth income percentile. Indeed,
the size of the effect almost doubled for the full sample of single people
and those below the twenty-sixth income percentile.
Finally, welfare policy reforms in 1996 could have produced erroneous results in our analyses. When the welfare reform initiative was launched, legal immigrants (resident aliens) who were not citizens lost access to public welfare benefits. This legislation was altered in 1997, however, to grandfather in those individuals who were receiving SSI benefits before the 1996 legislation. Nonetheless, these changes likely did have some impact on immigrants participation in SSI and thus where they fell in the income distribution between 1990 and 2000. Including or excluding immigrants in the analysis, however, had little impact on the results (estimates not shown in tables).
Summary and Discussion
Do income support policies, particularly those focused on the poorest elderly Americans, reduce old-age disability? The findings from this study support the hypothesis that between 1990 and 2000, within-state changes in the maximum state SSI benefit did lead to changes in disability among elderly individuals. Higher benefits were linked to lower disability rates. Among all single elderly individuals, a $100 increase in the maximum monthly SSI benefit led the rate of mobility limitations to fall by 0.46 percentage points. Because about 10 percent of single individuals receive SSI benefits, this effect could be as much as ten times this size for SSI recipients.
The findings were robust to varying sensitivity analyses. First, samples limited to individuals most likely to receive SSI benefits produced larger effects, and samples limited to individuals least likely to receive SSI benefits produced no measurable effect. Second, varying the disability measure did not meaningfully alter the findings. Third, excluding the institutionalized population, immigrants, individuals living in states with very large benefit changes, and individuals living in states with no supplements did not change the substantive conclusions. Fourth, Medicaid did not appear to confound the effects. Finally, these results were robust for married individuals.
We are hesitant to draw strong conclusions about the size of the effect until further studies are done. Nonetheless, it is important to say something about the plausibility of the effect size that we did find. We estimate that the effect size for SSI recipients could range up to a 4.6 percentage point reduction for a $100 increase in monthly benefit, which is essentially an 11 percent reduction in mobility limitations for around a 15 to 20 percent change in income.6 It is difficult to make comparisons with other studies, in part because the measures are different and in part because there is little to no agreement in the literature on the magnitude of the effects of income on disability or health. Moreover, many of the existing studies do not take into account the nonlinear effects of income on health, that is, that the effects of income may be larger for lower-income people, further limiting our ability to make comparisons across studies. One true income experiment among the poor elderly is PROGRESA, which was conducted in Mexico in the late 1990s, with about one in nine Mexican households receiving PROGRESA benefits, which increased their income by about 20 percent (Gertler 2000). That study found that for those aged fifty and older, the 20 percent increase in income led to about a 20 percent reduction in the number of days reported having difficulty completing normal activities of daily living. Thus, the effect in Mexico was bigger (about double), although obviously poverty is much more severe in Mexico and we should expect a larger effect. However, this study does provide some evidence that the magnitude of the effect we estimated among poor elderly in the United States is plausible.
From a theoretical perspective, this study provides evidence supporting the potential for upstream solutions to socioeconomic disparities in health. Fundamental cause theory would predict that by shifting resources to those at the bottom, income supports would improve health. But most policy efforts to improve the populations health have focused on downstream solutions, particularly attempts to expand access to health care through varying health policy mechanisms.7 While these are by no means ineffectual strategies, they likely are incomplete (Graham 2004). The continuing socioeconomic disparities in health in countries with universal access to health care make this clear. This study reveals the potentially beneficial impact on disability of increasing income supports, particularly among the poorest Americans, as an alternative or supplemental strategy for improving their health.
There are some important caveats to these findings, however. First, to address selection effects, we did not restrict the analysis to SSI recipients. Thus, although we correctly estimated the effects on the population we examined, that is, how changes in maximum SSI benefits would affect disability prevalence among single elderly Americans, we were not looking at how increasing SSI benefits affected specific individuals receiving those benefits. While the quality of self-reported SSI income data and the potential for endogeneity make our approach preferable, logic and sensitivity analyses that include only SSI recipients suggest that the effect would be larger in this group, but by an amount that is impossible to estimate precisely with the available data.
Second, a key assumption of this study is that changes in state SSI policies are exogenous to changes in state old-age disability rates, conditional on changes in sociodemographic and other factors in the state accounted for in the regression. While examining within-state changes in SSI maximum benefits over time (or generally the use of state and year fixed-effect models) is a relatively common methodological answer to concerns about endogeneity, a potential weakness with the state and year fixed-effect model is that there could be unobserved covariates correlated with within-state changes in maximum SSI benefits. Such unobserved covariates could produce a spurious relationship between SSI and functional limitations among the elderly. In this case, we were concerned that changes in SSI eligibility could be correlated with changes in Medicaid receipt for the elderly. But we found no evidence for this.
While our findings are quite robust, further analyses are needed to confirm their reliability. Future research should examine a variety of different income support policies. Aside from SSI, there are numerous other income support policies, from the Earned Income Tax Credit to Social Security, that could be studied. But it also is clear that we need better data to conduct these studies. Few data sources include extensive information on both income and health, particularly in a longitudinal framework. And longitudinal surveys that track outcomes before and after a new policy change or that are experimental in nature often fail to collect extensive information on health. For example, while some surveys were created as part of evaluations of negative income tax policies in the 1970s and welfare reform in the mid- to late 1990s, these studies largely focused on economic well-being and labor force participation. An exception is the work by Bitler and Hoynes (Forthcoming), who used the available measures collected in welfare evaluations to examine the effects of welfare reforms on health.
More broadly, further research is needed on the question of whether (and how) social and economic policies affect health. The United States spends nearly twice as much on health care as other industrialized countries do, but on basic health measures the United States lags well behind. While most would agree that medical care, and access to that care, is an important predictor of good health, it is becoming increasingly clear that medical care is not the only or even the primary predictor of good health. Thus, recent research that concentrates on connections between social and economic factors and health sets the stage for analyses like ours, which explicitly explore whether there are connections between social and economic policies and health. Ultimately, if public policy is to play a role in improving population health, we must have a clearer understanding of the different ways in which it can do so.
Endnotes
1 One of the most important studies of the relationship between income and health in the elderly is a true experiment conducted in Mexico in the late 1990s (Gertler 2000). Under an income support experiment, entitled PROGRESA, the Mexican government has been providing about $800 million in aid to 2.6 million rural families, almost one-third of all rural families. The results showed striking improvements in health for children, adults, and those over age fifty. Those over age fifty whose only requirement for participation was a yearly preventive checkup had significant reductions in activity limitations owing to illness, fewer days bedridden due to sickness, and a more general increase in energy levels as measured by their ability to walk distances without significant fatigue. Children and adults also showed improved outcomes. But the independent effect of income on the childrens health due to the medical care requirements linked to the receipt of income benefits could not be proved. Of course, the limitation of this study is the fact that it was conducted in a developing country, and it is unclear whether the results are applicable to a wealthier country.
2 Although most studies have found that overall disability rates in the elderly have improved over this time period (Freedman, Martin, and Schoeni 2002), this is not true for every disability measure. For example, while the mobility limitation prevalence increased slightly between 1990 and 2000, the ADL disability declined. Comparisons with analogous disability measures in the Medicare Current Beneficiary Survey (MCBS) showed trends similar to what we found in the census. That is, ADL disability rates in the MCBS fell during this period, and although it has no question exactly like the mobility measure in the census, some measures of mobility in the Medicare Current Beneficiary Survey (including the ability to walk one-quarter of a mile unaided) worsened over this period. Therefore, the trends in disability and limitation in the census are not inconsistent with evidence from other national surveys.
3 The income percentiles were measured within states to ensure that the populations were similar within states between 1990 and 2000. For households with multiple persons, household income was used but then adjusted to account for household size.
4 The 1992 Current Population Survey (CPS) was used because questions regarding type of health insurance did not appear in the 1990 or 1991 CPS.
5 Separate analyses of the 1990 and 2000 data not including state fixed effects show that higher SSI state maximum benefits were associated with lower probabilities of mobility limitations. For every $100 increase in the SSI state maximum, there was a .008 and .010 reduction in the probability of having a mobility limitation in 1990 and 2000, respectively.
6 Dividing the mobility limitation percentage point change among all single people by the percent receiving SSI (.46/.10) equals 4.6 percentage points. The approximate mobility limitation rate among the SSI population is 40 percent (it is 40 percent whether we look at those reporting SSI or those reporting below the twenty-sixth income percentile). This is about an 11 percent reduction for a $100 increase in the maximum benefit, or between a 15 percent and 20 percent increase in income among the very poorest elderly Americans (generally those falling below 90 percent of the poverty level).
7 Although to the extent that expanded access to health insurance reduces out-of-pocket costs, this too could be in the spirit of an upstream solution.
References
Adams, P., M.D. Hurd, D. McFadden, A. Merrill, and T. Ribeiro. 2003. Healthy, Wealthy, and Wise? Tests for Direct Causal Paths between Health and Socioeconomic Status. Journal of Econometrics 112:356.
Adda, J., T. Chandola, and M. Marmot. 2003. Socio-Economic Status and Health: Causality and Pathways. Journal of Econometrics 112:5763.
Adler, N., T. Boyce, M. Chesney, S. Folkman, and S.L. Syme. 1994. SES and Health. American Psychologist 49(1):1524.
Alaimo, K., C.M. Olson, E.A. Frongillo, and R.R. Briefel. 2001. Food Insufficiency, Family Income, and Health in US Children. American Journal of Public Health 91(5):78186.
Anderson, K.H. and R.V. Burkhauser. 1985. The Retirement-Health Nexus: A New Measure of an Old Puzzle. The Journal of Human Resources 20(3):315330.
Backlund, E., P. Sorlie, and N.J. Johnson. 1996. The Shape of the Relationship between Income and Mortality in the United States: Evidence from the National Longitudinal Mortality Study. Annals of Epidemiology 6:1223.
Baker, L.C., and A.B. Royalty. 2000. Medicaid Policy, Physician Behavior, and Health Care for the Low-Income Population. Journal of Human Resources 35(3):480502.
Bassuk, S.S., L.F. Berkman, and B.C. Amick. 2002. Socioeconomic Status and Mortality among the Elderly: Findings from Four Communities. American Journal of Epidemiology 155(6):520533.
Benzeval, M., K. Judge, and S. Shouls. 2001. Understanding the Relationship between Income and Health: How Much Can Be Gleaned from Cross-Sectional Data? Social Policy & Administration 35(4):37696.
Bitler, M., and H. Hoynes. Forthcoming. Welfare Reform and Indirect Impacts on Health. In Health Effects of Non-Health Policy, edited by J. House, R. Schoeni, H. Pollack, and G. Kaplan. New York: Russell Sage.
Black, D., J.N. Morris, C. Smith, P. Townsend, S. Blume, A.J. Forsdick, and N. Hart. 1982. Inequalities in Health: The Black Report. New York: Penguin.
Bollinger, C. 1998. Measurement Error in the Current Population Survey: A Nonparametric Look. Journal of Labor Economics 16(3):57694.
Bound J., M. Schoenbaum, T.R. Stinebrickner, and T. Waidmann. 1999. The Dynamic Effects of Health on the Labor Force Transitions of Older Workers. Labour Economics 6(2):179202.
Byrne, D.G., and H.M. Whyte. 1980. Life Events and Myocardial Infarction Revisited: The Role of Measures of Individual Impact. Psychosomatic Medicine 42(1):110.
Case, A. 2004. Does Money Protect Health Status? Evidence from South African Pensions. In Perspectives on the Economics of Aging, edited by D. Wise, 287311. (Chicago: University of Chicago Press).
Cohen, S., D. Tyrell, and A. Smith. 1993. Negative Life Events, Perceived Stress, and Susceptibility to the Common Cold. Journal of Personality and Social Psychology 64:13140.
Costa, D. 1999. A House of Her Own: Old Age Assistance and the Living Arrangements of Older Nonmarried Women. Journal of Public Economics 72(1):3959.
Currie, J., and N. Cole. 1993. Welfare and Child Health: The Link between AFDC Participation and Birth Weight. American Economic Review 83(4):97185.
Currie, J., and J. Grogger. 2002. Medicaid Expansions and Welfare Contractions: Offsetting Effects on Prenatal Care and Infant Health. Journal of Health Economics 21:31335.
Currie, J., and J. Gruber. 1996. Saving Babies: The Efficacy and Cost of Recent Expansions of Medicaid Eligibility for Pregnant Women. Journal of Political Economy 104(6):126396.
Dooley, M.D., S. Gascon, P. Lefebvre, and P. Merrigan. 2000. Lone Female Headship and Welfare Policy in Canada. Journal of Human Resources 35(3):587602.
Duleep, H.O. 1986. Measuring the Effect of Income on Adult Mortality Using Longitudinal Administrative Data. Journal of Human Resources 21(2):23851.
Duncan, T. 1994. Like Father, Like Son; Like Mother, Like Daughter: Parental Resources and Child Height. Brazil, Ghana and United States. Journal of Human Resources 29:95088.
Ellison, G. 2002. Letting the Genie Out of the Bottle? Challenges Facing the Relative Income Hypothesis. Social Science & Medicine 54(4):56176.
Engelhardt, G., and J. Gruber. 2004. Social Security and the Evolution of Elderly Poverty. NBER Working Paper #10466. Cambridge, Mass: NBER.
Epel, E.S., E.H. Blackburn, J. Lin, F. Dhabhar, N. Adler, J.D. Morrow, and R.M. Cawthon. 2004. Accelerated Telomere Shortening in Response to Life Stress. Proceedings of the National Academy of Sciences 101(49):1731215.
Ferraro, K., and M. Farmer. 1999. Utility of Health Data from Social Surveys: Is There a Gold Standard for Measuring Morbidity? American Sociological Review 64:30315.
Fox, A.J., P.O. Goldblatt, and D.R. Jones. 1985. Social Class Mortality Differentials: Artefact, Selection, or Life Circumstances. Journal of Epidemiology and Community Health 39:18.
Freedman, V., L. Martin, and R. Schoeni. 2002. Recent Trends in Disability and Functioning among Older Adults in the United States: A Systematic Review. JAMA 288(24):313746.
Frijters, P., J. Haisken-DeNew, and M. Shields. 2005. The Causal Effect of Income on Health: Evidence from German Reunification. Journal of Health Economics 24(5):9971017.
Fullilove, M.T., and R.E. Fullilove III. 2000. Whats Housing Got to Do with It? American Journal of Public Health 90(2):18384.
Gertler, P. 2000. Final Report: The Impact of PROGRESA on Health. Washington, DC: International Food Policy Research Institute.
Goesling, B., and G. Firebaugh. 2004. The Trend in International Health Inequality. Population and Development Review 30(1):13146.
Graham, H. 2004. Social Determinants and Their Unequal Distribution. Milbank Quarterly 82(1):10124.
Grogger, J. 2003. The Effects of Time Limits, the EITC, and Other Policy Changes on Welfare Use, Work, and Income among Female- Headed Families. Review of Economics and Statistics 85(2):394408.
Grossman, M. 1972. On the Concept of Health Capital and the Demand for Health. Journal of Political Economy 80(2):22355.
Haan, M.N., G. Kaplan, and S.L. Syme. 1989. Socioeconomic Status and Health: Old Observations and New Thoughts. In Pathways to Health: The Role of Social Factors, edited by J.P. Bunker, D.S. Gomby, and B.H. Kehrer, 76135. Menlo Park, Calif.: Henry J. Kaiser Family Foundation.
Haveman, R., K. Holden, K. Wilson, and B. Wolfe. 2003. Social Security, Age of Retirement, and Economic Well-Being: Intertemporal and Demographic Patterns among Retired-Worker Beneficiaries. Demography 40(2):36994.
Hayward, M., A. Pienta, and D. McLaughlin. 1997. Inequality in Mens Mortality. Journal of Health and Social Behavior 38(4):31330.
Herd, P. 2006. Do Functional Health Inequalities Decrease in Old Age? Educational Status and Functional Decline among the 19311941 Birth Cohort. Research on Aging 28:37592.
Herd, P., B. Goesling, and J.S. House. 2007. Socioeconomic Position and Health: The Differential Effects versus Income on the Onset versus Progression of Health Problems. Journal of Health and Social Behavior 48(3):223238.
Hoffman, S.D., and E.M. Foster. 2000. AFDC Births and Nonmarital Births to Young Women. The Journal of Human Resources 35(2):376391.
House, J.S., R. Kessler, and A. Herzog. 1990. Age, Socioeconomic Status and Health. Milbank Quarterly 68(3):383411.
House, J.S., K. Landis, and D. Umberson. 1988. Social Relationships and Health. Science 241:54045.
House, J.S., J. Lepkowski, A. Kinney, R. Mero, R. Kessler, and A.R. Herzog. 1994. The Social Stratification of Aging and Health. Journal of Health and Social Behavior 35(3):21334.
House, J.S., and D. Williams. 2000. Understanding and Reducing Socioeconomic and Racial/Ethnic Disparities in Health. In Promoting Health: Intervention Strategies from Social and Behavioral, edited by B.D. Smedly and S.L. Syme, 82124. Washington, D.C.: National Academy Press.
Huynh, M., K. Rupp, and J. Sears. 2001. The Assessment of Survey and Income and Program Participation Benefit Data Using Longitudinal Administrative Records. Paper 238. Washington, D.C.: U.S. Bureau of the Census. Available at http://www.bls. census.gov/sipp/workpapr/wp238.pdf (accessed January 15, 2006).
Joyce, T. and R. Kaestner. 1996. The Effect of Expansions in Medicaid Income Eligibility on Abortion. Demography 33(2):181192.
Kehrer, B., and C. Wolin. 1979. Impact of Maintenance on Low Birth Weight: Evidence from the Gay Experiment. Journal of Human Resources 14(4):43462.
Kington, R., and J. Smith. 1997. Socioeconomic Status and Racial and Ethnic Differences in Functional Status. American Journal of Public Health 87(5):80510.
Komisar, H., J. McCool-Hunt, and J. Feder. 1998. Medicare Spending for Elderly Beneficiaries Who Need Long-Term Care. Inquiry 34(4):30210.
Kreiger, J., and D.L. Higgins. 2002. Housing and Health: Time Again for Public Health Action. American Journal of Public Health 92(5):75868.
Lantz, P., J.S. House, J. Lepkowski, D. Williams, R. Mero, and J. Chen. 1998. Socioeconomic Factors, Health Behaviors, and Mortality. Journal of the American Medical Association 279(21):17038.
Lantz, P., J.S. House, R. Mero, and D. Williams. 2005. Stress, Life Events and Socioeconomic Disparities in Health: Results from the American Changing Lives Study. Journal of Health and Social Behavior 46(3):27488.
Lichter, D.,D. McLaughlin, and D. Ribar. 1997.Welfare and the Rise in Female-Headed Families. American Journal of Sociology 103(1):11243.
Lillard, L., and Y. Weiss. 1996. Uncertain Health and Survival: Effect on End-of-Life Consumption. Journal of Business and Economic Statistics 15(2):25468.
Lindahl, M. 2005. Estimating the Effect of Income on Health and Mortality Using Lottery Prizes as an Exogenous Source of Variation in Income. Journal of Human Resources 40(1):14468.
Link, B., and J. Phelan. 1995. Social Conditions as Fundamental Causes of Disease. Journal of Health and Social Behavior (extra issue):8094.
Lynch, J.W., G. Kaplan, and S.J. Shema. 1997. Cumulative Impact of Sustained Economic Hardship on Physical, Cognitive, Psychological, and Social Functioning. New England Journal of Medicine 337:188995.
Mare, R.D. 1990. Socioeconomic Status Careers and Differential Mortality among Older Men in the United States. In Measurement and Analysis of Mortality: New Approaches, edited by J. Vallin, S. DSouza, and A. Palloni, 36287. Oxford: Clarendon.
Marmot, M. 2004. Commentary: Risk Factors or Social Causes? International Journal of Epidemiology 33(2):28996.
Martikainen, P., P. Mäkelä, S. Koskinen, and T. Valkonen. 2001. Income Differences in Mortality: A Register-Based Follow-Up Study of Three Million Men and Women. International Journal of Epidemiology 30:1397405.
Martin, T., and P.S. Davies. 2003. Changes in the Demographic and Economic Characteristics of SSI and DI Beneficiaries between 1984 and 1999. Social Security Bulletin 65(2):113.
McDonough, P., and P. Berglund. 2003. Histories of Poverty and Self-Rated Health Trajectories. Journal of Health and Social Behavior 44(2):198214.
McDonough, P., G.J. Duncan, D. Williams, and J.S. House. 1997. Income Dynamics and Adult Mortality in the United States, 1972 through 1989. American Journal of Public Health 87(9):147683.
McGarry, K., and R. Schoeni. 2000. Social Security, Economic Growth, and the Rise in Elderly Widows Independence in the 20th Century. Demography 37(2):22136.
McGinnis, M.J., P. Williams-Russo, and J. Knickman. 2002. The Case for More Active Policy Attention to Health Promotion. Health Affairs 21(2):7893.
Menchik, P.L. 1993. Economic Status as a Determinant of Mortality among Black and White Older Men: Does Poverty Kill? Population Studies 47(3):42736.
Mirowsky, J., and C.E. Ross. 2001. Education, Social Status, and Health. New York: Aldine.
Moffit, R. 1994. Welfare Effects on Female Headship with Area Effects. Journal of Human Resources 29(2):62136.
Moffitt, R. 2004. The Role of Randomized Field Trials in Social Science Research: A Perspective from Evaluations of Reforms of Social Welfare Programs. American Behavioral Scientist, January, 506540.
Mulatu, M.S., and C. Schooler. 2002. Causal Connections between Socioeconomic Status and Health: Reciprocal Effects and Mediating Mechanisms. Journal of Health and Social Behavior 43(2):2241.
Neumark, D., and E. Powers. 1998. The Effect of Means-Tested Income Support for the Elderly on Pre-Retirement Saving: Evidence from the SSI Program in the U.S. Journal of Public Economics 68(2):181205.
Neumark, D., and E. Powers. 2000. Welfare for the Elderly: The Effects of SSI on Pre-Retirement Labor Supply. Journal of Public Economics 78:5180.
Neumark, D., and E.T. Powers. 2003. The Effects of Changes in State SSI Supplements on Pre-Retirement Labor Supply. NBER Working Paper W9851. Cambridge, Mass: NBER.
Norris, J.C., M.J. van der Laan, S. Lane, J.N. Anderson, and G. Block. 2003. Nonlinearity in Demographics and Behavioral Determinants of Morbidity. Health Services Research 38(6):1791818.
Palumbo, M. 1999. Uncertain Medical Expenses and Precautionary Saving Near the End of the Life Cycle. Review of Economic Studies 66(227):395421.
Pappas, G., S. Queen, W. Hadden, and G. Fisher. 1993. The Increasing Disparity in Mortality between Socioeconomic Groups in the United States. New England Journal of Medicine 329(15):1139.
Pope, A.M., and A.R. Tarlov, eds. 1991. Disability in America: Toward a National Agenda for Prevention. Washington, D.C.: National Academy Press.
Rodin, J. 1986. Aging and Health: Effects of Sense of Control. Science 233:14349.
Rosenzweig, M. 1999. Welfare, Marital Prospects, and Nonmarital Childbearing. Journal of Political Economy 107(6):S3S32.
Rowe, J.W., and R.L. Kahn. 1987. Human Aging: Usual and Successful. Science 237:14349.
Ruhm, C.J. 2000. Are Recessions Good for Your Health? Quarterly Journal of Economics 115(2):61750.
Schoeni, R.F., J.S. House, G.A. Kaplan, and H. Pollack. Forthcoming. Making Americans Healthier: Social and Economic Policy as Health Policy. New York: Russell Sage.
Smith, J.P. 1999. Healthy Bodies and Thick Wallets: The Dual Relation between Health and Economic Status. Journal of Economic Perspectives 13(2):14566.
Snyder, S., and W. Evans. 2006. The Effect of Income on Mortality: Evidence from the Social Security Notch. Review of Economics and Statistics 88(3):48295.
Social Security Administration. 2001. Annual Statistical Supplement. Available at www.ssa.gov (accessed February 15, 2006).
Stokols, D. 1992. Establishing and Maintaining Healthy Environments: Toward a Social Ecology of Health Promotion. American Psychologist 47(1):622.
Stronks, K., H.D. van der Mheen, and J.P. Mackenbach. 1998. A Higher Prevalence of Health Problems in Low Income Groups: Does It Reflect Relative Deprivation? Journal of Epidemiology and Community Health 52:54857.
Taubman, P.J., and R.C. Sickles. 1983. Supplemental Social Insurance and the Health of the Poor. NBER Working Paper 1062. Cambridge, Mass: NBER.
Turner, R.J., and S. Noh. 1988. Physical Disability and Depression: A Longitudinal Analysis. Journal of Health and Social Behavior 29:2337.
Turner, R.J., and F. Marino. 1994. Social Support and Social Structure: A Descriptive Social Epidemiology. Journal of Health and Social Behavior 35:193212.
Verbrugge, L.M., and A.M. Jette. 1994. The Disablement Process. Social Science and Medicine 38:114.
Williams, D., and C. Collins. 1995. US Socioeconomic and Racial Differences in Health: Patterns and Explanations. Annual Review of Sociology 21:34986.
World Health Organization. 2006. Commission on the Social Determinants
of Health. Available at http://www.who.int/social_
determinants/resources/csdh_brochure.pdf (accessed September 15,
2007).
Acknowledgments: This research was supported by the National Institutes for Aging (R03 AG0276611).
Address correspondence to: Pamela Herd, Department of Sociology, University
of Wisconsin, 1180 Observatory Drive, Madison, WI 53706 (email: pherd@
lafollette.wisc.edu).
The Milbank Memorial Fund is an endowed operating foundation that engages in nonpartisan analysis, study, research, and communication on significant issues in health policy. In the Fund's own publications, in reports, films, or books it publishes with other organizations, and in articles it commissions for publication by other organizations, the Fund endeavors to maintain the highest standards for accuracy and fairness. Statements by individual authors, however, do not necessarily reflect opinions or factual determinations of the Fund.
©2008 Milbank Memorial Fund. All rights reserved. This publication may be redistributed electronically, digitally, or in print for noncommercial purposes only as long as it remains wholly intact, including this copyright notice and disclaimer.
Printed in the United States of America.
Online producer: Stephanie Moe-Quiggle